Charts
Your energy history, any way you slice it
Day, week, month, year, and lifetime views of solar, home, battery, and grid, with comparison mode, per-bar breakdowns, a data table, and CSV export.
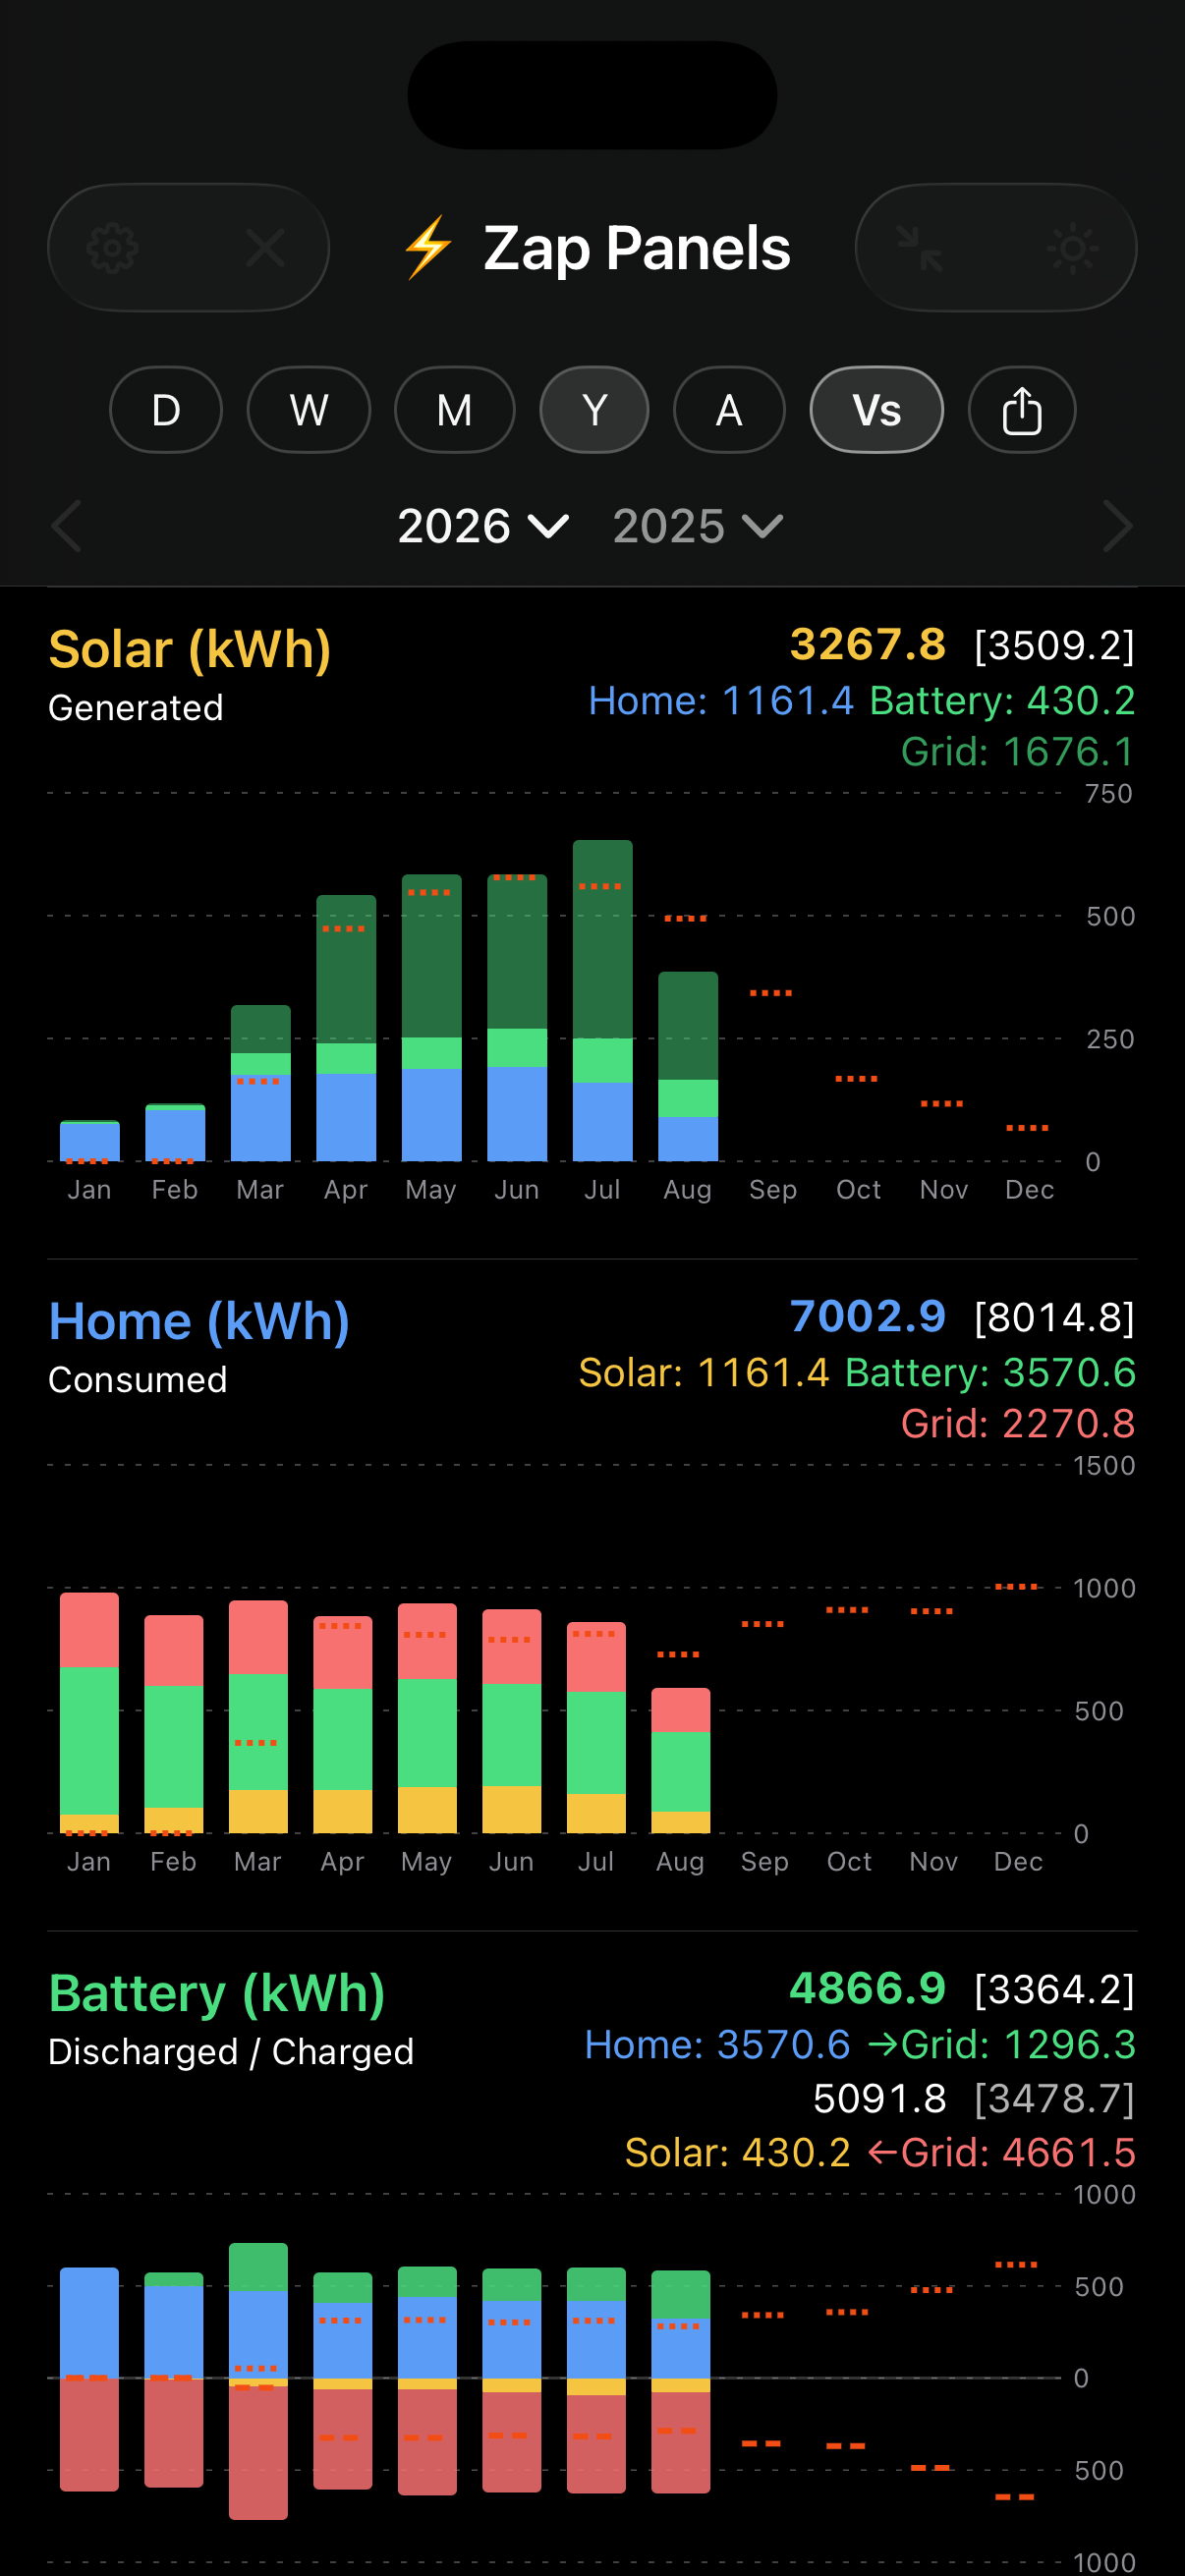
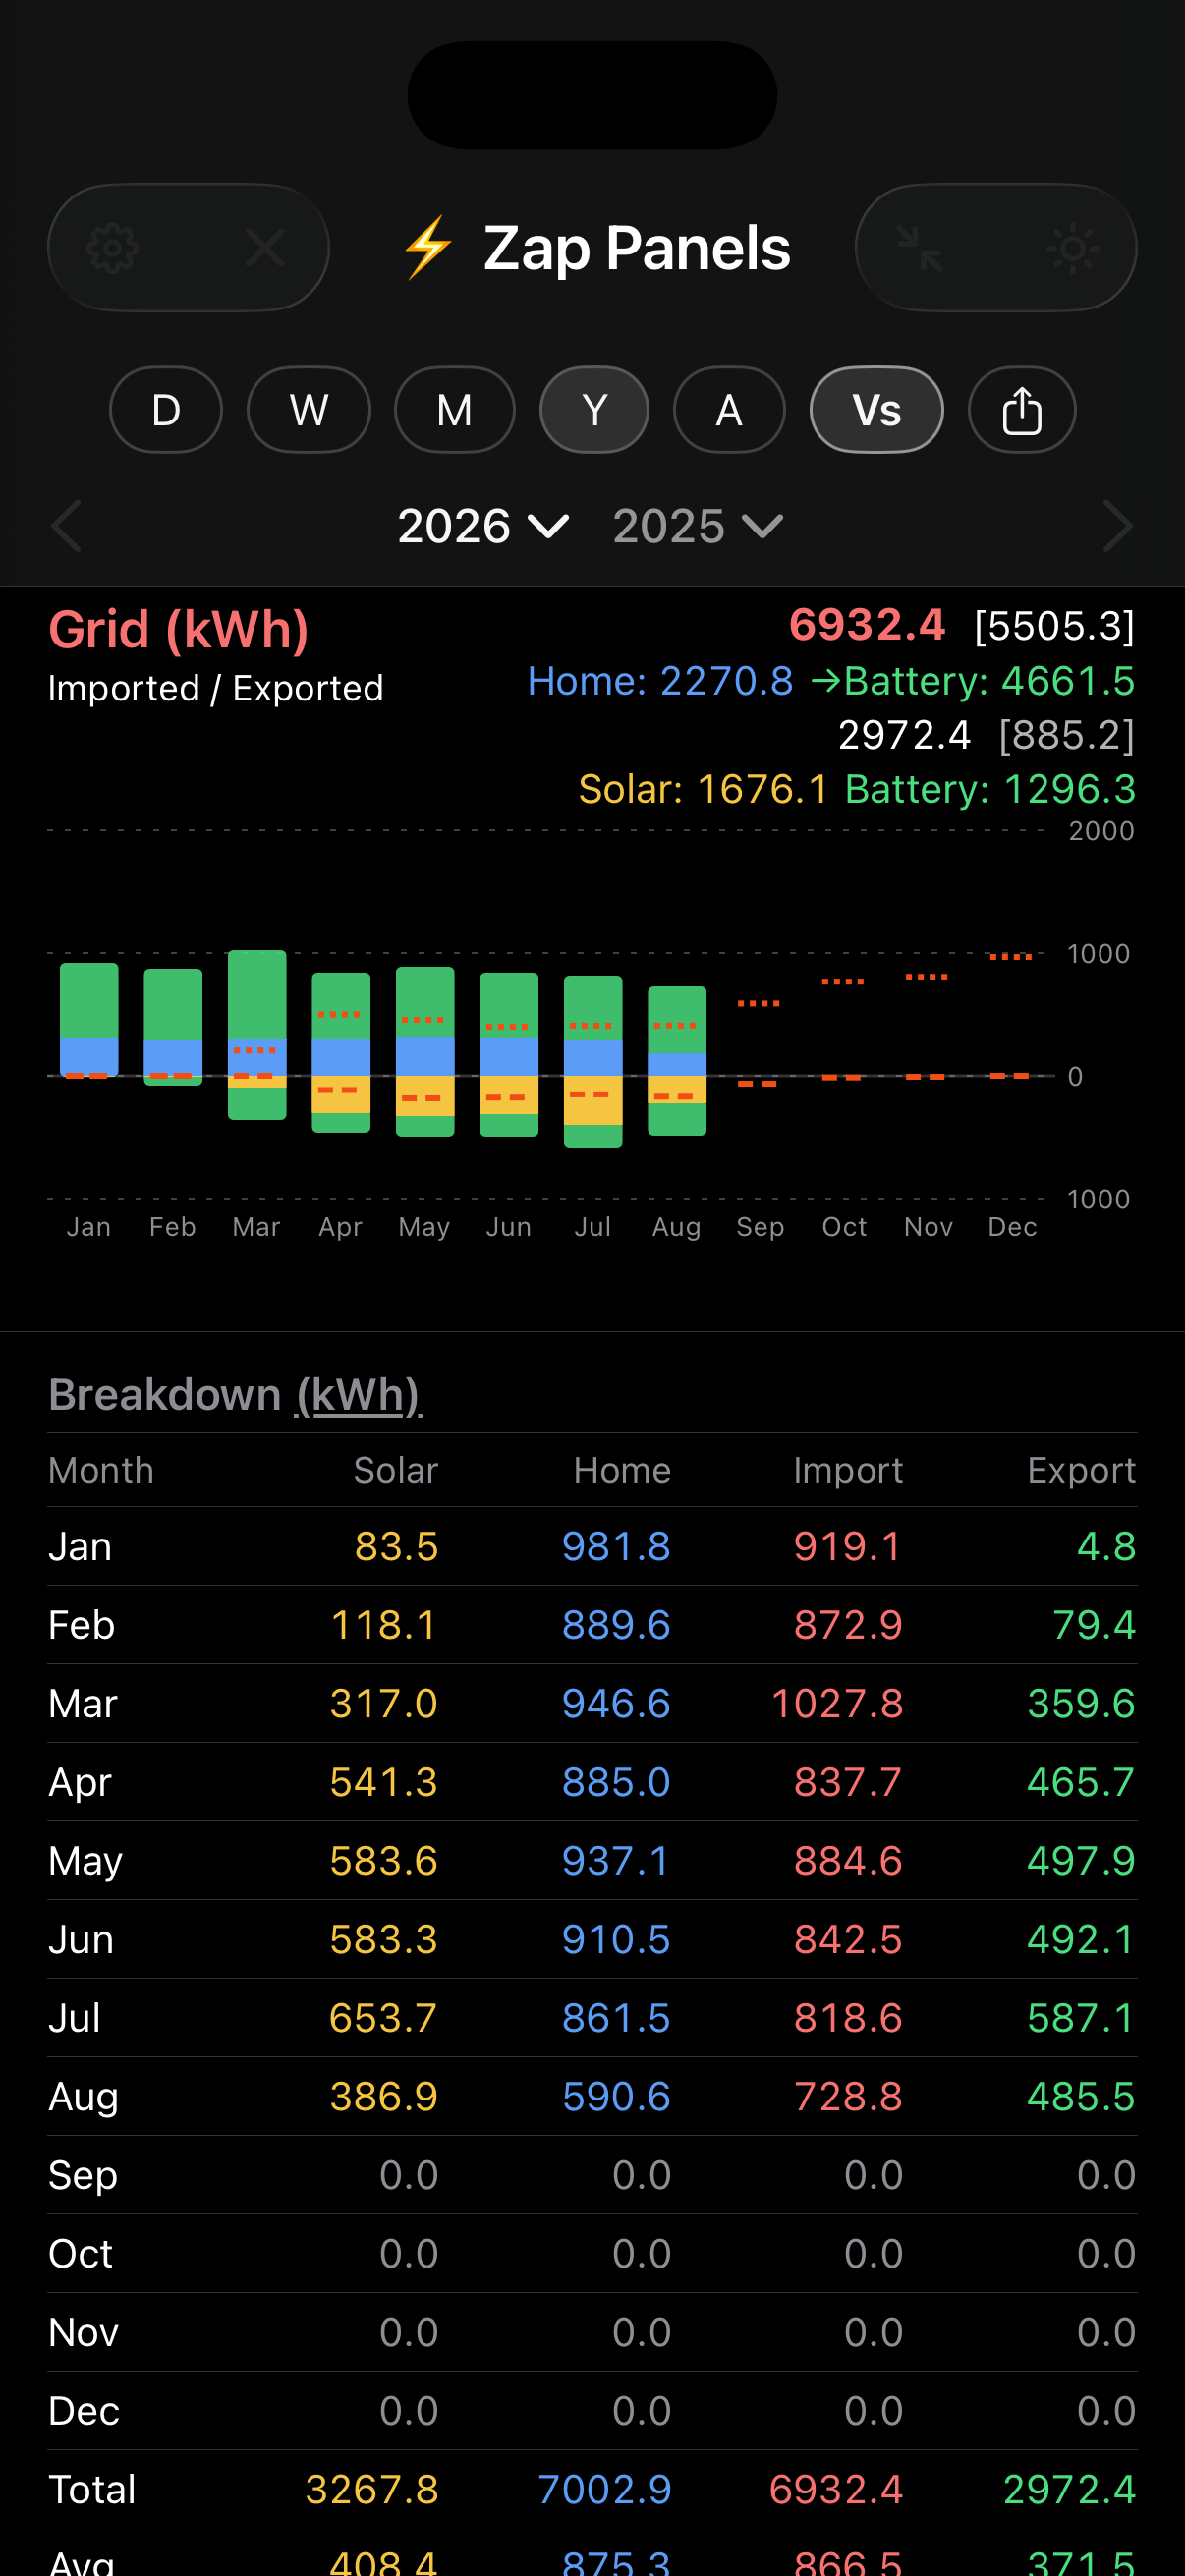
Time period views
- The buttons along the top switch the range: D (day), W (week), M (month), Y (year), and A (all time / lifetime)
- The chart re-aggregates for the range you pick: hourly bars for a day, daily bars for a week, monthly bars for a year, and so on
- Switching range resets the view to the current period (today, this week, this month, and so on)
Energy flow figures
- Each section shows the total energy flow for the displayed period: Solar generated, Home consumed, Battery discharged and charged, and Grid imported and exported
- Beneath each headline figure is the split by source or destination, for example how much of your home demand was met by solar, battery, and grid
- Each bar is colour coded into segments so you can see where the energy flowed from and to at a glance
- Figures are totals for the whole period, not an instantaneous rate: kWh in most views, switching to MWh in the lifetime (A) view
Comparison mode
- Tap Vs to turn on comparison mode and compare two periods, for example this year against last year
- Two date selectors appear at the top: the primary period on the left and the secondary period on the right
- The bars represent the primary period. Red dotted lines mark the matching values from the secondary period so you can see the difference at a glance
- Each headline figure shows the primary total with the secondary total alongside it in brackets
Drill into a single bar
- Tap any individual bar to view the breakdown just for that bar, for example one day within a week or one month within a year
Navigating between periods
- Swipe left and right on the chart to step through periods
- Use the chevrons at the top to move one period back or forward
- Tap the date to open the picker and jump straight to a specific period
Pull to refresh
- Pull down and release on the chart screen to force a data refresh for the period currently displayed
Data table
- Scroll to the bottom of the screen for a data table view of the displayed period
- The table lists each period along with totals, averages, and a self-sufficiency percentage
Export CSV
- Tap the share icon to export a CSV file of the data for the period currently displayed, ready to open in a spreadsheet