The Dashboard
Four panels. Your whole energy picture.
What each panel shows, how the indicators work, and what the Premium features unlock.
-

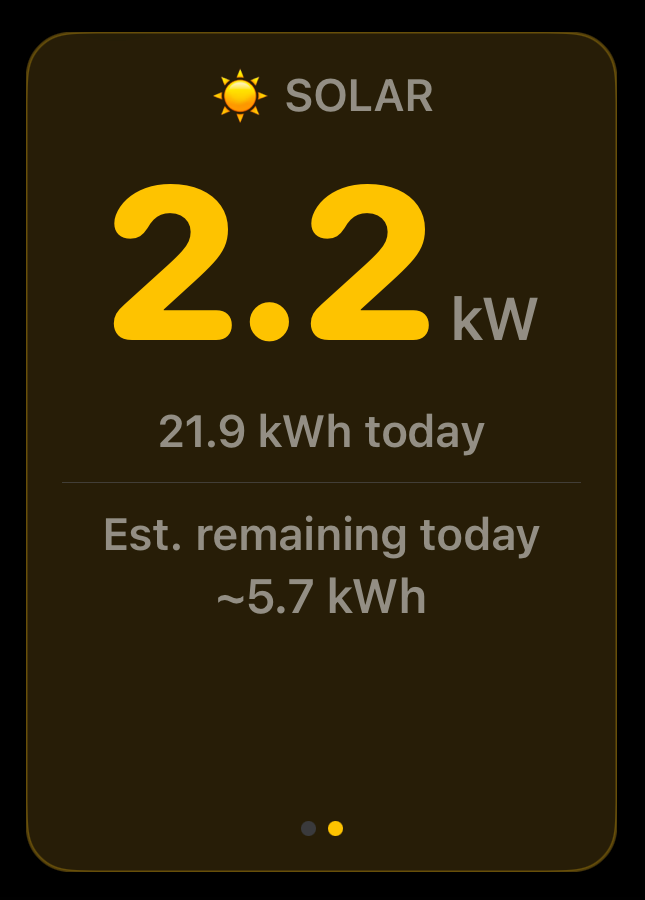
Solar
- Live solar generation in kW, updated in near real time
- Today's total kWh generated
- View cycles between a daytime weather forecast (each emoji represents a 3-hour period) and an estimated generation figure for the day or tomorrow if after sunset (Premium)
- Panel highlights when solar is active
- Tap to advance the carousel manually or configure app to rotate views automatically
-
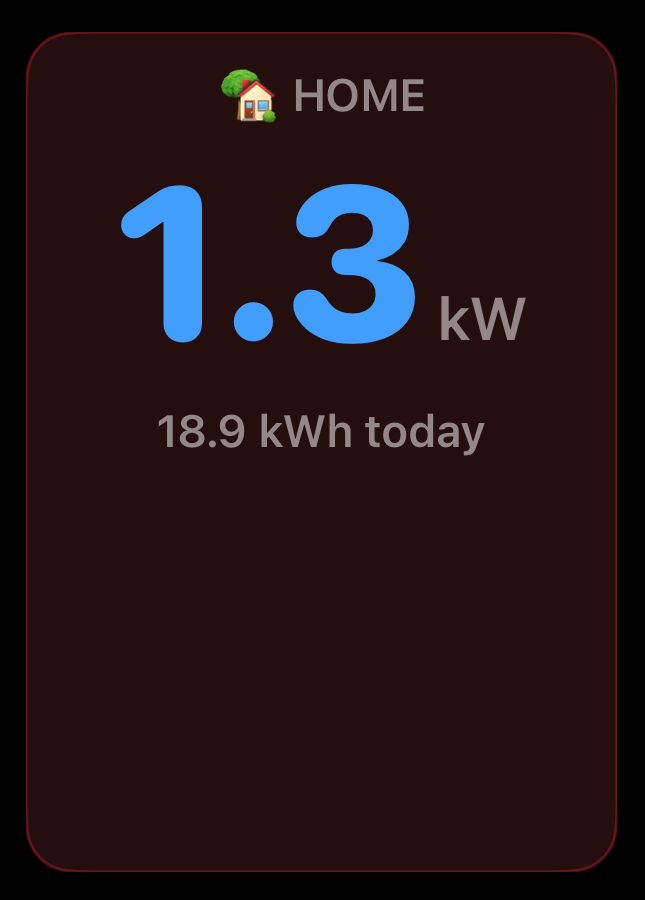
Home
- Live household consumption in kW
- Today's total energy used
- Panel highlights red when your home is drawing power
-
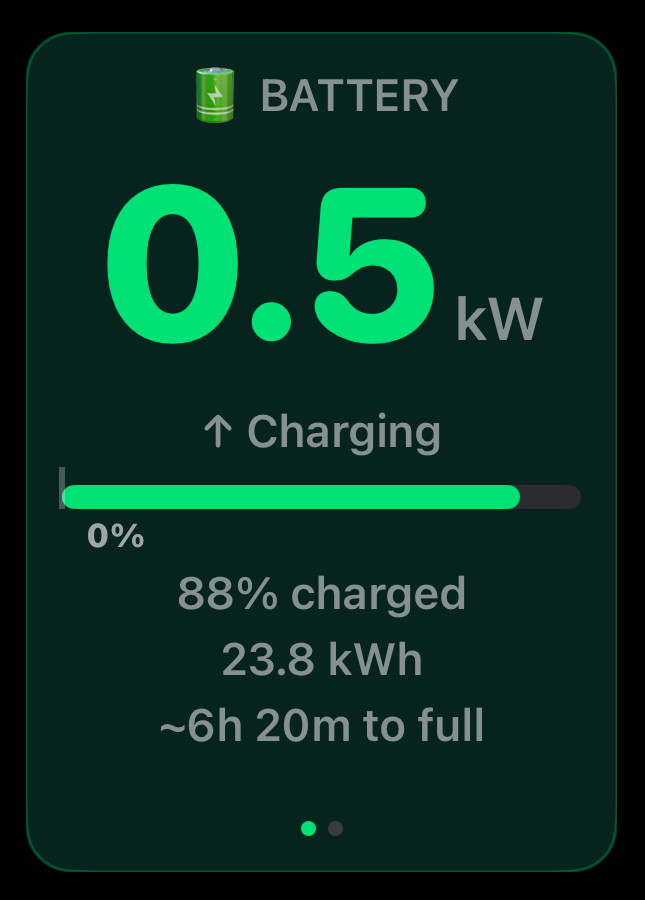
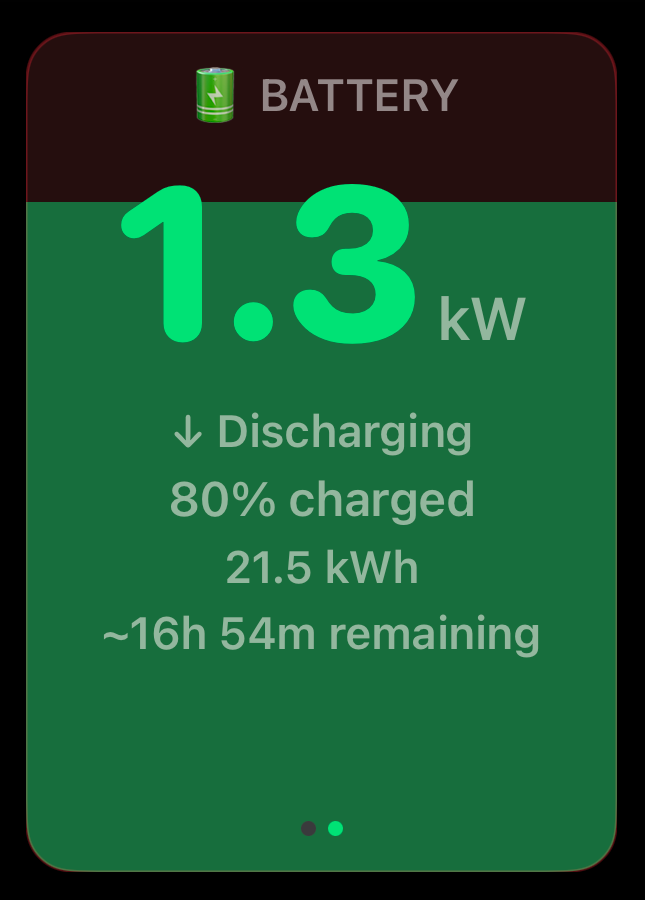
Battery
- State of charge, charge or discharge rate, and stored energy in kWh
- Charge bar with backup reserve threshold marker
- Estimated time to full or time remaining when charging or discharging
- Background colour reflects direction: green when charging, red when discharging
- Tap to switch to a fill view showing charge level visually
-
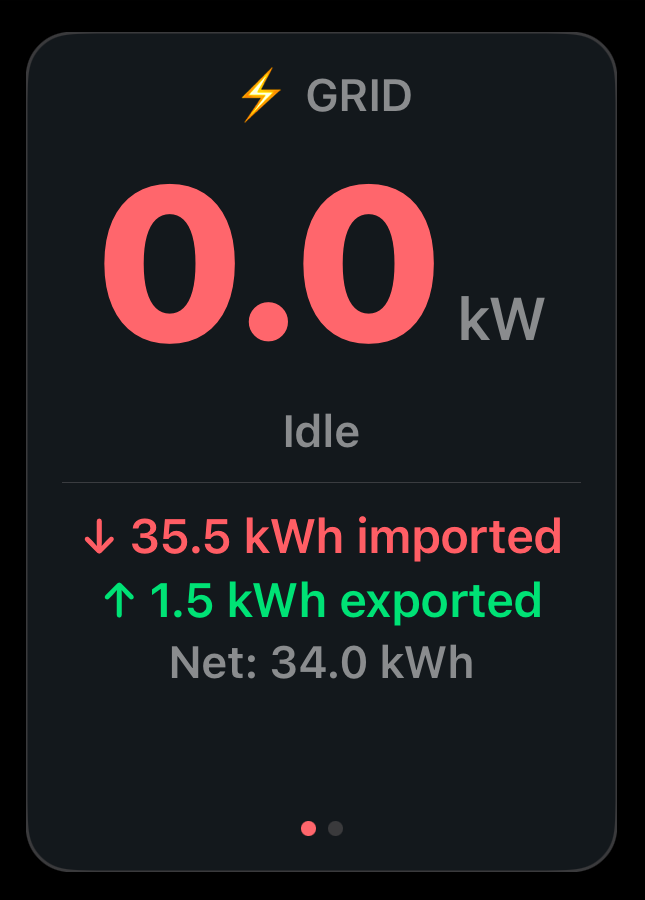
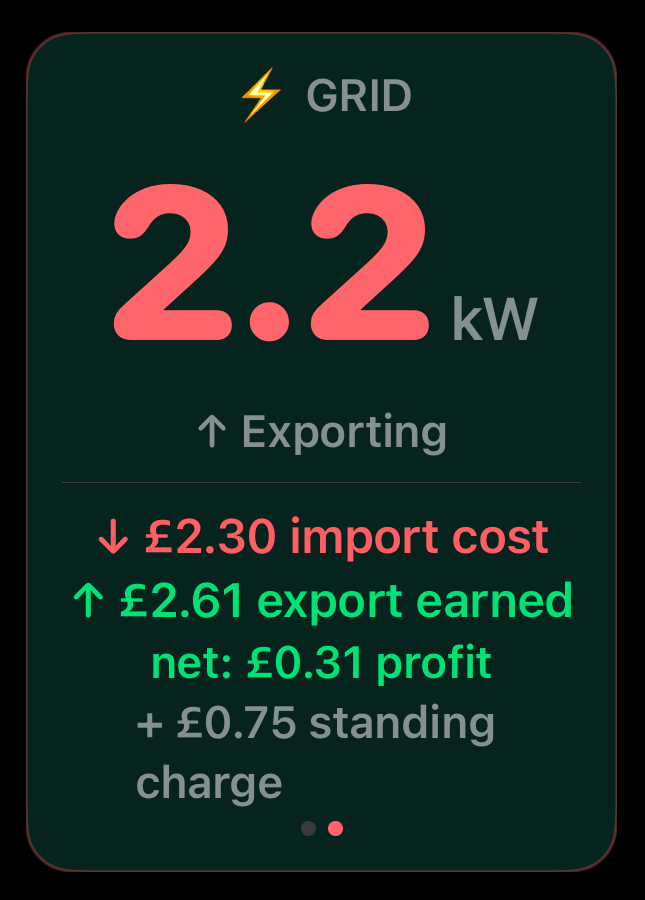
Grid
- Live import or export in kW with direction
- Today's kWh totals for energy imported and exported
- Panel turns green when exporting surplus, red when importing from the grid
- Tap to switch to a cost view showing import cost, export earnings, and net profit or cost (Premium) or configure app to rotate views automatically